Abstract
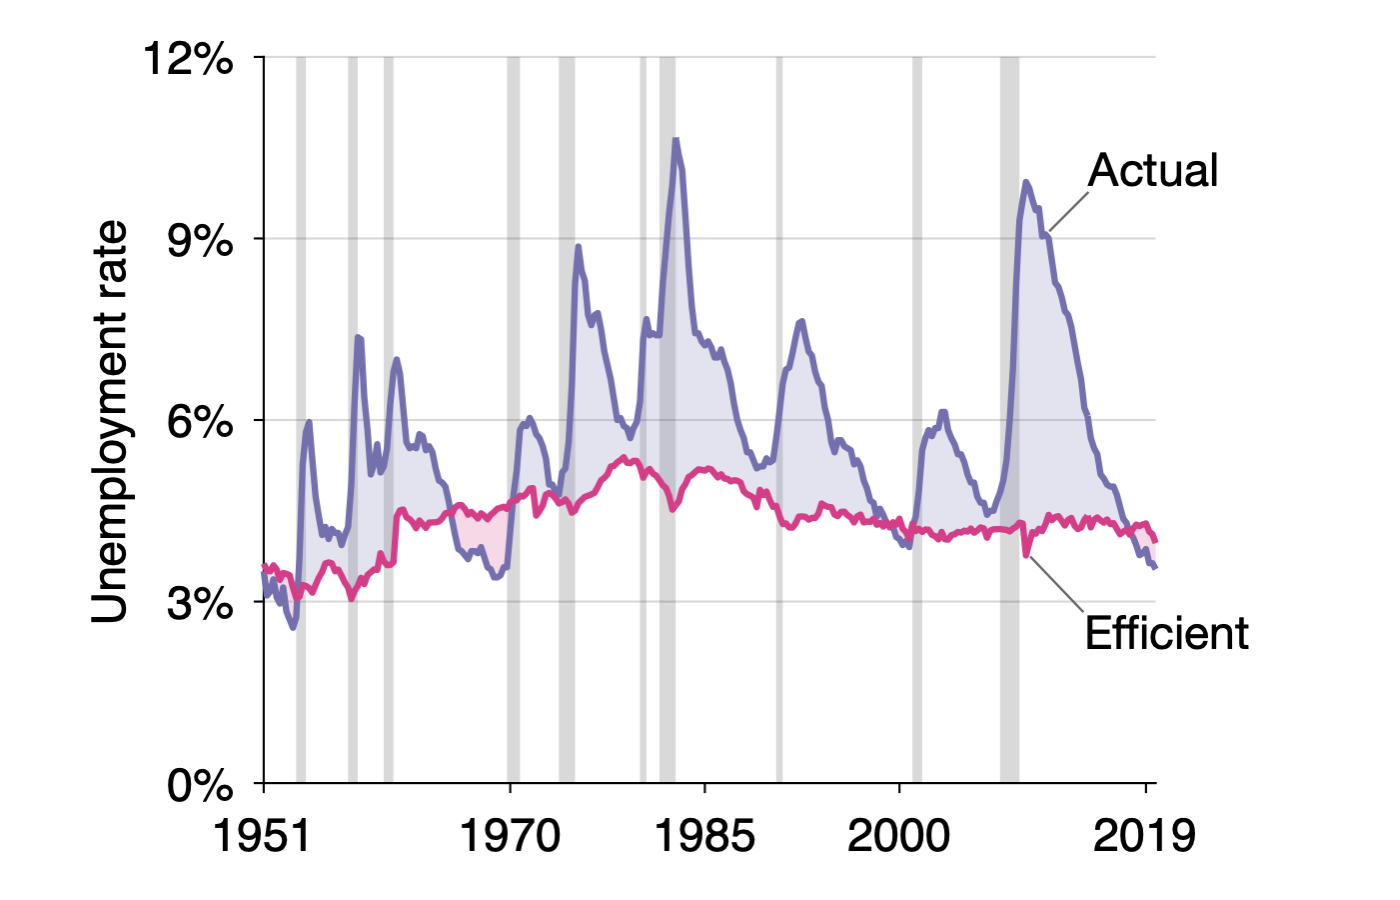
This paper develops a sufficient-statistic formula for the unemployment gap—the difference between the actual unemployment rate and the efficient unemployment rate. While lowering unemployment puts more people into work, it forces firms to post more vacancies and to devote more resources to recruiting. This unemployment-vacancy tradeoff, governed by the Beveridge curve, determines the efficient unemployment rate. Accordingly, the unemployment gap can be measured from three sufficient statistics: elasticity of the Beveridge curve, social cost of unemployment, and cost of recruiting. Applying this formula to the United States, 1951–2019, we find that the efficient unemployment rate averages 4.3%, always remains between 3.0% and 5.4%, and has been stable between 3.8% and 4.6% since 1990. As a result, the unemployment gap is countercyclical, reaching 6 percentage points in slumps. The US labor market is therefore generally inefficient and especially inefficiently slack in slumps. In turn, the unemployment gap is a crucial statistic to design labor-market and macroeconomic policies.
Figure 7A: Tightness gap in the United States, 1951–2019
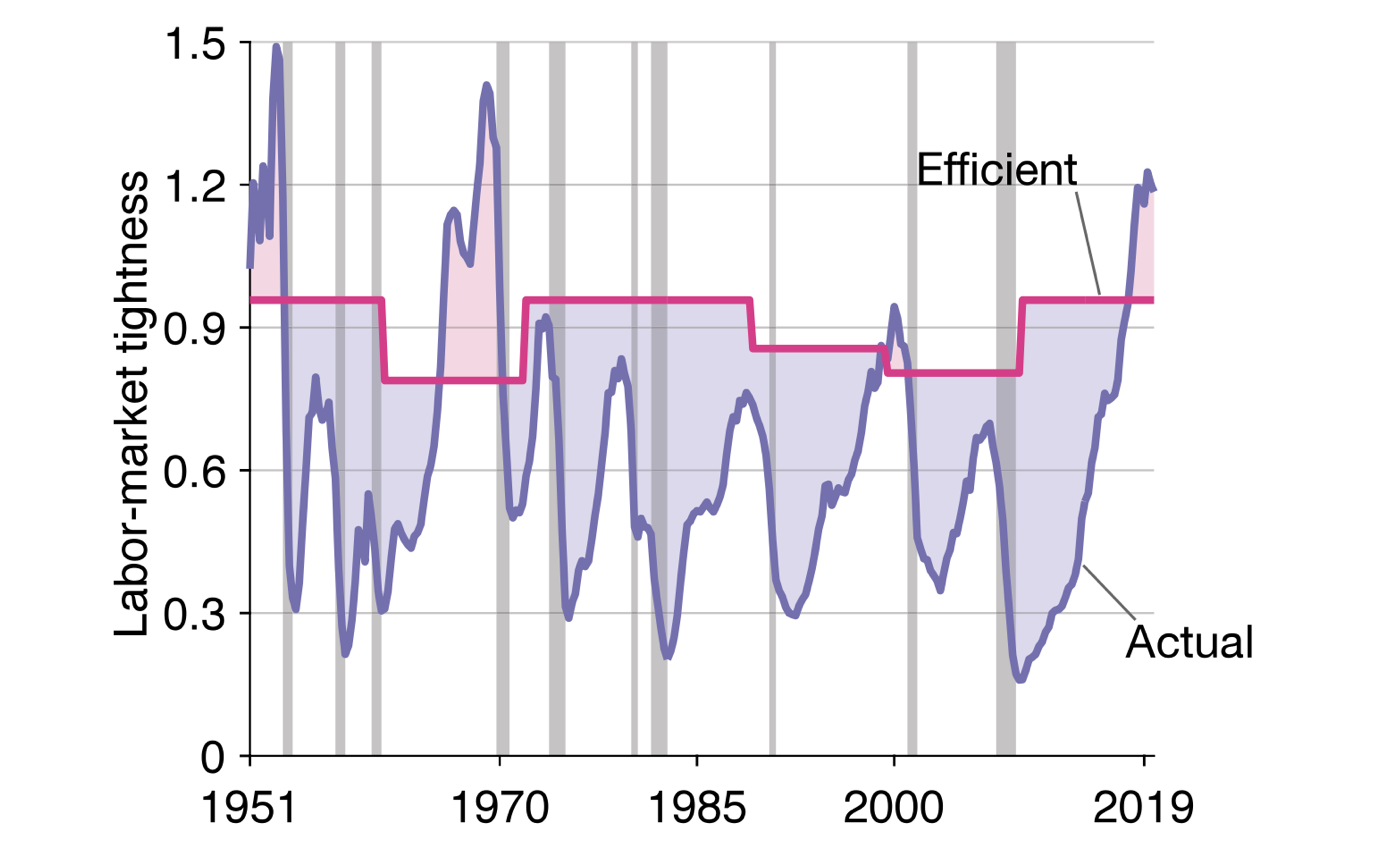
Figure 7B: Unemployment gap in the United States, 1951–2019
Citation
Michaillat, Pascal, and Emmanuel Saez. 2021. “Beveridgean Unemployment Gap.” Journal of Public Economics Plus 2: 100009. https://doi.org/10.1016/j.pubecp.2021.100009.
@article{MS21,
author = {Pascal Michaillat and Emmanuel Saez},
year = {2021},
title = {Beveridgean Unemployment Gap},
journal = {Journal of Public Economics Plus},
volume = {2},
pages = {100009},
doi = {https://doi.org/10.1016/j.pubecp.2021.100009}}
Related material
- Presentation slides
- Nontechnical summary
- Follow-up paper (2024) - This paper shows that under a realistic calibration for the United States, the sufficient-statistic formula for the efficient unemployment rate collapses to a strikingly simple expression: $u^\ast=\sqrt{uv}$. The efficient unemployment rate is the geometric average of the unemployment and vacancy rates, and it averages 4.1% in the United States between 1930 and 2024.