Abstract
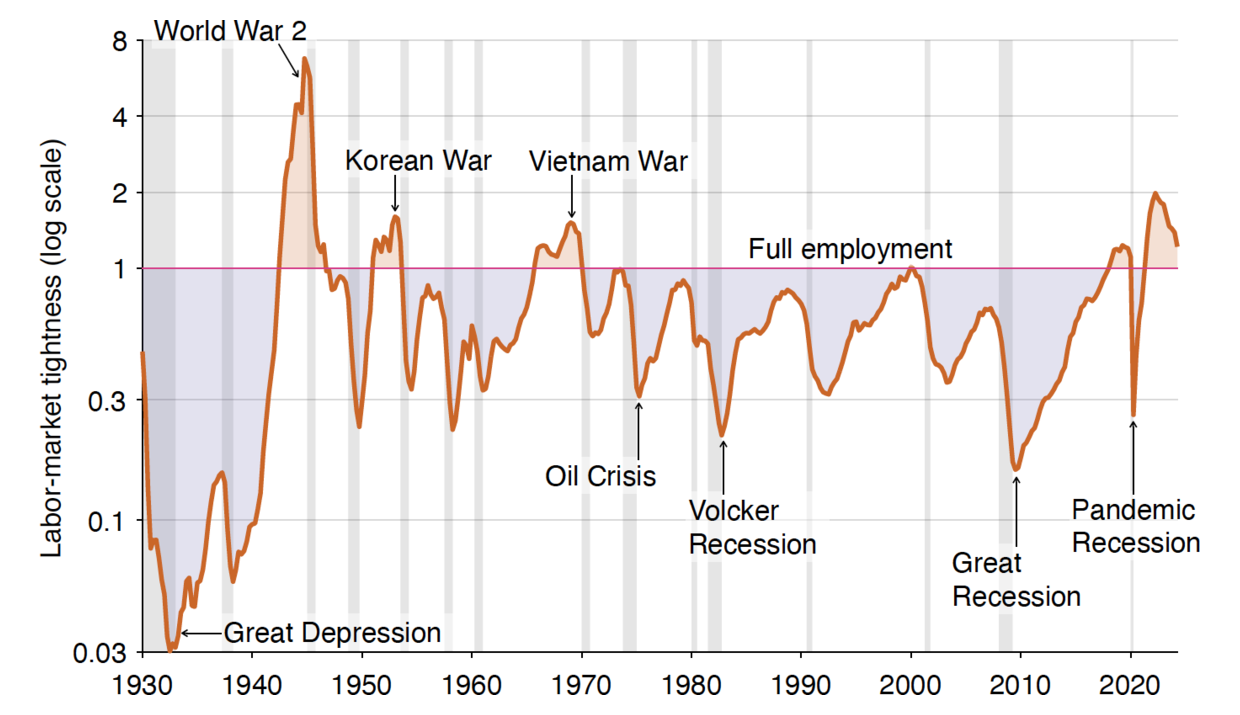
This paper computes the unemployment rate $u^\ast$ that is consistent with full employment in the United States. First, the paper argues that social efficiency is the most appropriate economic interpretation of the legal concept of full employment. Here efficiency means minimizing the nonproductive use of labor—both unemployment and recruiting. As it takes one worker to service one job vacancy, the nonproductive use of labor is measured by the number of job seekers and job vacancies, $u + v$. Through the Beveridge curve, the numbers of job seekers and vacancies are inversely related, $uv =$ constant. With such symmetry the labor market is efficient when there are as many job seekers as vacancies ($u = v$), inefficiently tight when there are more vacancies than job seekers ($v > u$), and inefficiently slack when there are more job seekers than vacancies ($u > v$). Accordingly, the full-employment rate of unemployment (FERU) is the geometric average of the unemployment and vacancy rates: $u^\ast = \sqrt{uv}$. From 1930 to 2024, the FERU averages 4.1 percent and is stable, remaining between 2.5 percent and 6.7 percent. Unemployment has generally been above the FERU ($u > u^\ast$), especially during recessions. Unemployment has only been below the FERU ($u < u^\ast$) during major wars, as well as shortly before and in the aftermath of the pandemic.
Figure 11: Unemployment, job vacancy, and FERU in the United States, 1930–2024
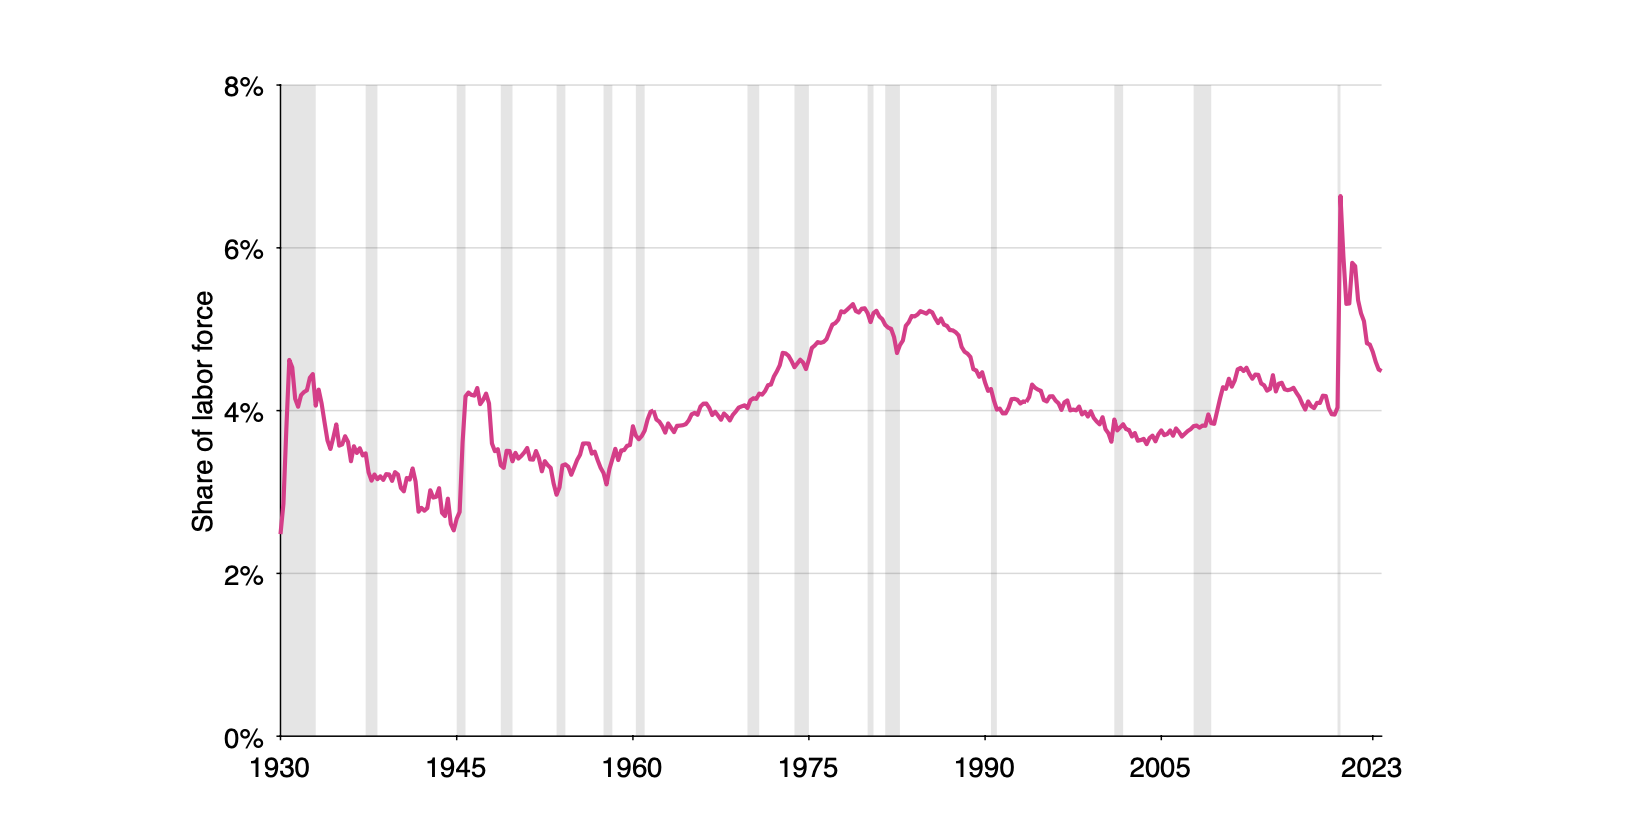
Figure 12: Labor market tightness in the United States, 1930–2024
Citation
Michaillat, Pascal, and Emmanuel Saez. 2024. “u* = √uv: The Full-Employment Rate of Unemployment in the United States.” Brookings Papers on Economic Activity 55 (2): 323–390. https://doi.org/10.1353/eca.2024.a964373.
@article{MS24,
author = {Pascal Michaillat and Emmanuel Saez},
year = {2024},
title = {$u^*=\sqrt{uv}$: The Full-Employment Rate of Unemployment in the United States},
journal = {Brookings Papers on Economic Activity},
volume = {55},
issue = {2},
pages = {323--390},
doi = {https://doi.org/10.1353/eca.2024.a964373}}